
こんにちは!yokoです。
「急に英語でプレゼンしないといけなくなった!」
そんな方に向けて、今回表、グラフの英語での表現方法をまとめました。
実際プレゼン中に使う英語表現を知りたい場合、こちらの記事をご覧ください(^^)/
この記事を読むことで、以下の疑問を解決!
・この表、グラフって英語でなんて言うの?
・この部分に注目してほしいんだけど、これを英語でなんて言うのかわからない!
・英語でグラフから読み取れることを説明したい!
・この表、グラフって英語でなんて言うの?
・この部分に注目してほしいんだけど、これを英語でなんて言うのかわからない!
・英語でグラフから読み取れることを説明したい!
表、グラフそのものの英語表現

表、グラフの種類
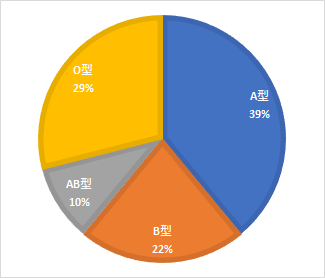
①円グラフ(pie chart)
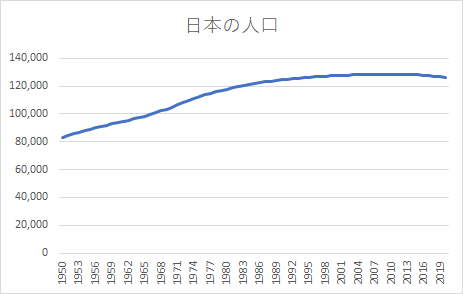
②折れ線グラフ(line chart)
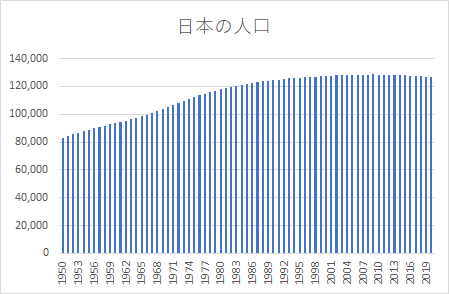
③縦棒グラフ(bar chart)
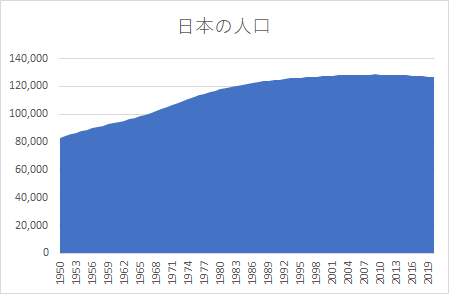
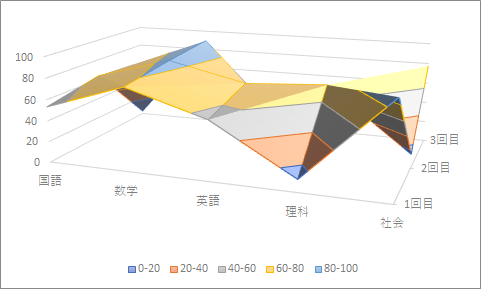
④面グラフ(area chart)
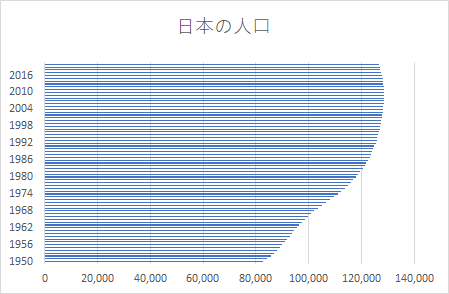
⑤横棒グラフ(horizontal bar chart)
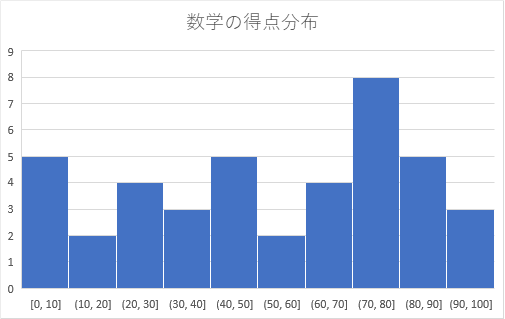
⑥ヒストグラム(histogram)
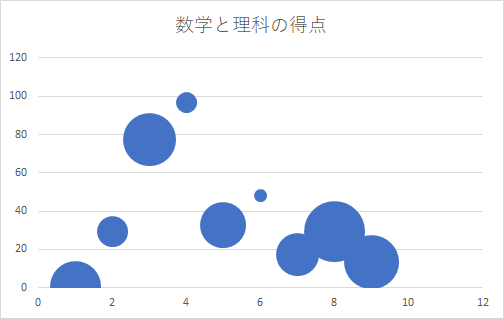
⑦バブルチャート(bubble chart)
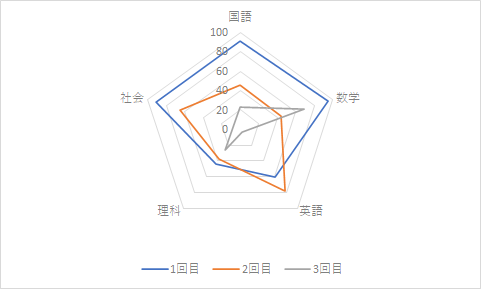
⑧レーダーチャート(radar chart)
⑨等高線チャート(contour chart)
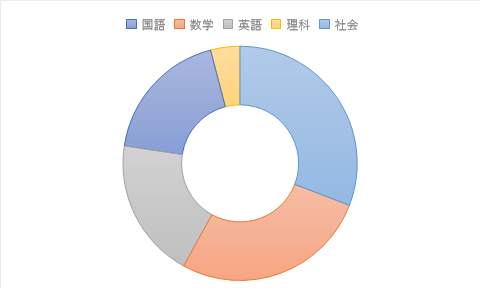
⑩ドーナツグラフ(doughnut chart)
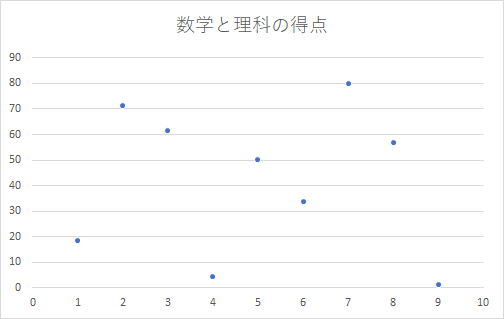
⑪散布図(scatter diagram)
⑫それ以外のグラフ
| 日本語 | 英語 |
| ベン図 | venn diagram |
| 表 | table / chart |
| 図 | figure / chart |
| 写真 | picture |
| 資料 | data |
表、グラフ中の場所
| 日本語 | 英語 |
|---|---|
| 縦軸 | vertical axis |
| 横軸 | horizontal axis |
| 実線 | solid line |
| 点線 | dotted line |
| 破線 | broken line |
| 割合 | rate |
| 平均 | average |
| 分布 | distribution |
| 網掛けの部分 | tinted area |
| 斜線の部分 | striped area |
| 表の上部 | at the top of the table |
| 表の中央部 | in the middle of the table |
| 表の下部 | at the bottom of the table |
| 表の右側 | on the right side of the table |
| 表の左側 | on the left side of the table |
プレゼンで説明するときの英語表現

上昇する
一般的な「上昇する」はincrease/rise/pick up/go upが使われます。
「急上昇する」はskyrocketが使われます。
また、「2倍になる」「3倍になる」はdouble/tripleが使われます。
TOYOTA stock price is increasing.
「トヨタの株は上がってきています。」
I don’t understand why the stock market rose yesterday.
「昨日なぜ株価が上がったのか理解できません。」
Our sales picked up last month.
「我々の売り上げは先月上がりました。」
Our sales have gone up30% since we started new marketing strategy.
「新しいマーケティング戦略を始めてから30%売り上げが上がっている。」
This stock price was skyrocketing.
「この株価は急騰している。」
This year’s sales expect to be doubled or tripled.
「今年の売り上げは2、3倍になる予定だ。」
下落する
一般的な「下落する」はdecline/drop/fall/go downが使われます。
「急落する」はslump/collapseが使われます。
TOYOTA stock price is declining.
「トヨタの株は下がってきています。」
I don’t understand why the stock market dropped yesterday.
「昨日なぜ株価が下がったのか理解できません。」
Our sales fall last month.
「我々の売り上げは先月下がりました。」
Our sales have gone down30% since we started new marketing strategy.
「新しいマーケティング戦略を始めてから30%売り上げが下がっている。」
This stock price was slumping.
「この株価は急落している。」
The market collapsed suddenly.
「市場は急落した。」
示す
一般的な「示す」はshow/represent/sayが使われます。
他に、As you can see from this graphとして「グラフからわかるように」と表すこともできます。
This line shows the operating profit margin.
「この線は営業利益率を示します。」
This represents positive feedbacks.
「これは肯定的なフィードバックを示します。」
It says our promotion strategy affects clients correctly.
「販売戦略は正しくクライアントに影響を与えられているということを示している。」
As you can see from this graph, the longer you sleep, the more happy you become.
「このグラフからわかるように、寝る時間が長くなるほど、幸福感は増す。」
「この線は営業利益率を示します。」
This represents positive feedbacks.
「これは肯定的なフィードバックを示します。」
It says our promotion strategy affects clients correctly.
「販売戦略は正しくクライアントに影響を与えられているということを示している。」
As you can see from this graph, the longer you sleep, the more happy you become.
「このグラフからわかるように、寝る時間が長くなるほど、幸福感は増す。」
予想される
「予想する」はexpectが使われます。
We can expect this year’s sales to double.
「今年の売り上げが2倍になることが予想される。」
「今年の売り上げが2倍になることが予想される。」
※予想するの表現はexpect/anticipate/predict等あります。こちらの記事にまとめられています(^^)/
占める
カジュアルな表現の「占める」はaccount for、フォーマルな表現の「占める」はoccupyです。
Our product occupiesabout 90% of the World market.
「私たちの製品は世界のマーケットの約90%を占めている。」
Our sales in Japan account for about two third of the total revenue.
「私たちの日本の売り上げは全体の3分の2を占めている。」
「私たちの製品は世界のマーケットの約90%を占めている。」
Our sales in Japan account for about two third of the total revenue.
「私たちの日本の売り上げは全体の3分の2を占めている。」


コメント